Testing
Overview
Once you have a dataset with ground truth established for your policy rules guardrail, it is then possible to meaningfully test the guardrail to determine if it is performing as expected. The platform's dataset testing capabilities enable you to run both accuracy and variance tests on your policy rules guardrail.
Creating a Test
To create a test, navigate to the "Test" tab from the main navigation bar on the left side of the page and then click "Create Test Job" in the top right corner.
This will bring up a modal, where you first need to provide the name of the "Dataset" you are using to test and the guardrail you are testing.
Once you have selected your desired policy rules guardrail, you should see that you can set both the dataset sample size and the types of tests to run. We walk through these settings in the sections below.
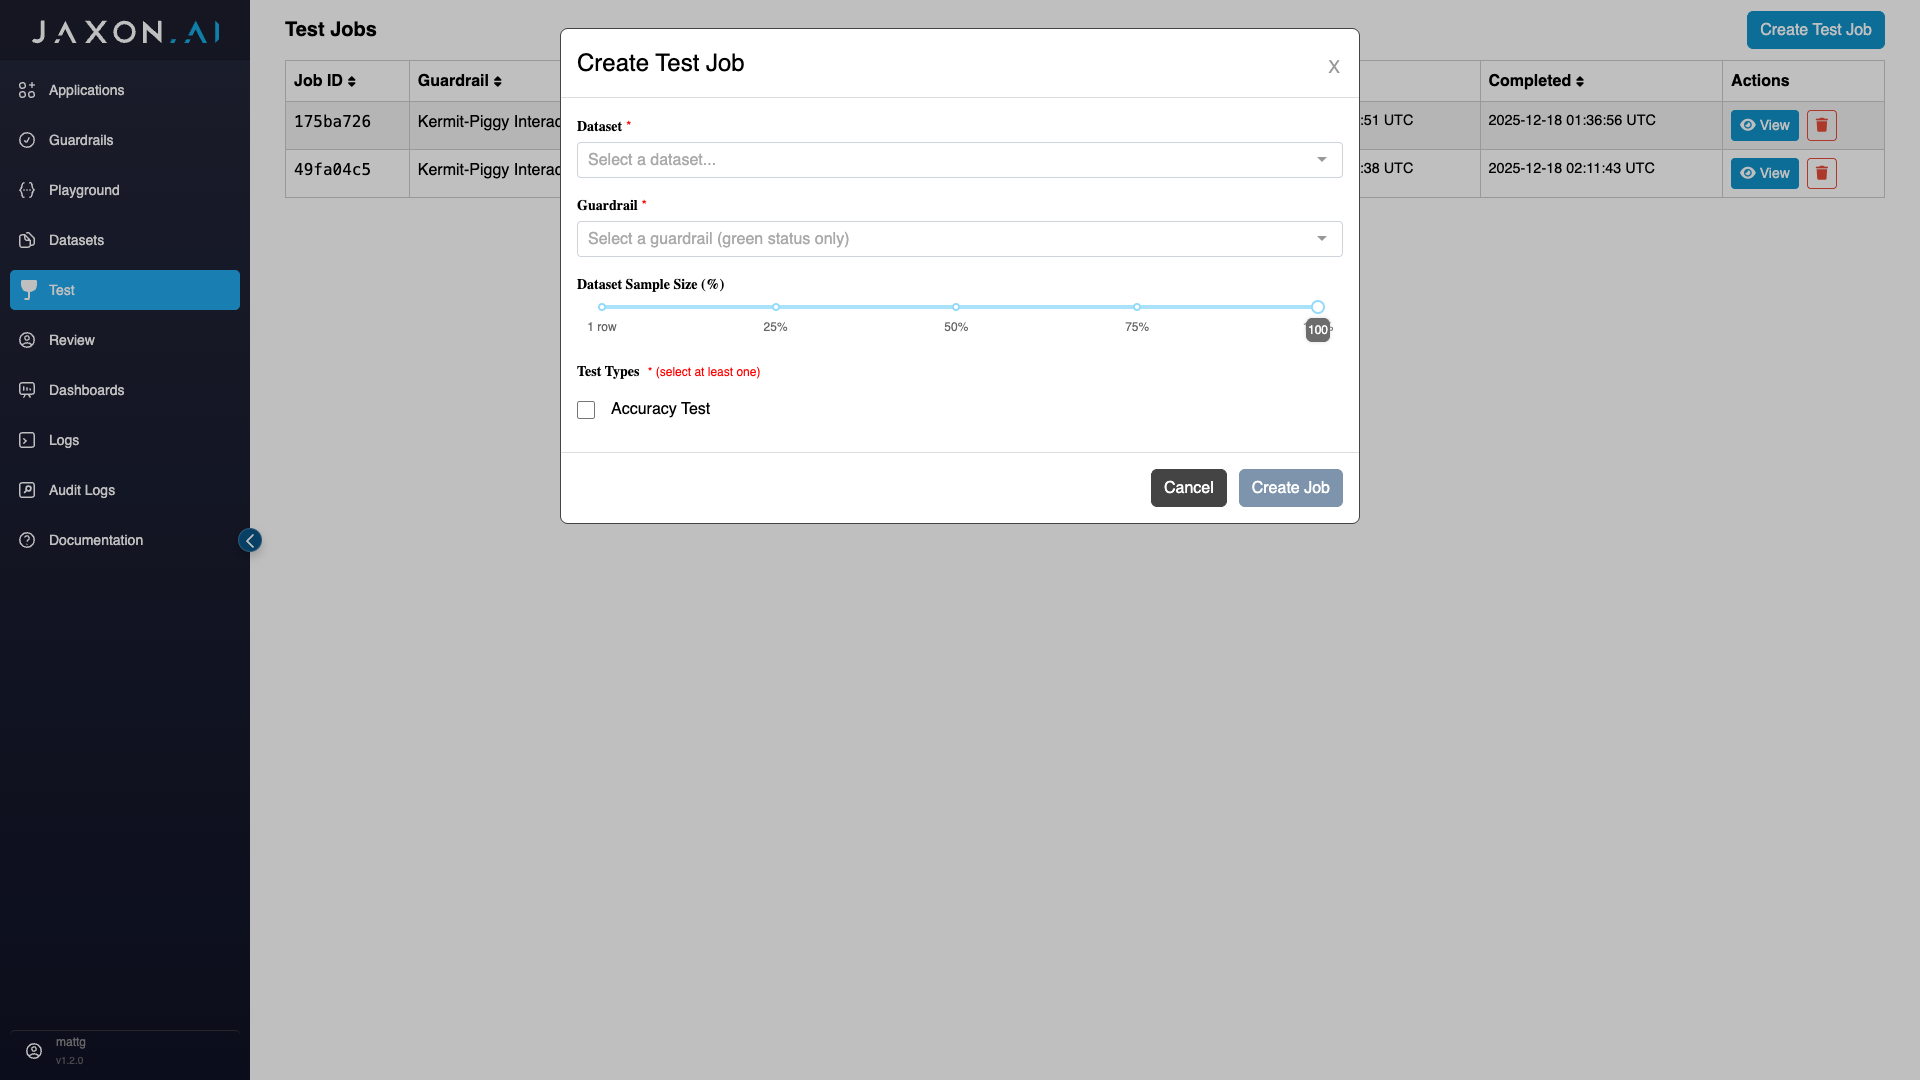
Setting Dataset Sample Size
THe "Dataset Sample Size" section allows you to specify how many rows of the original dataset you wish to use for your test. You have the option of using 100% of the original dataset or some percentage of it - all the way down to a single row.
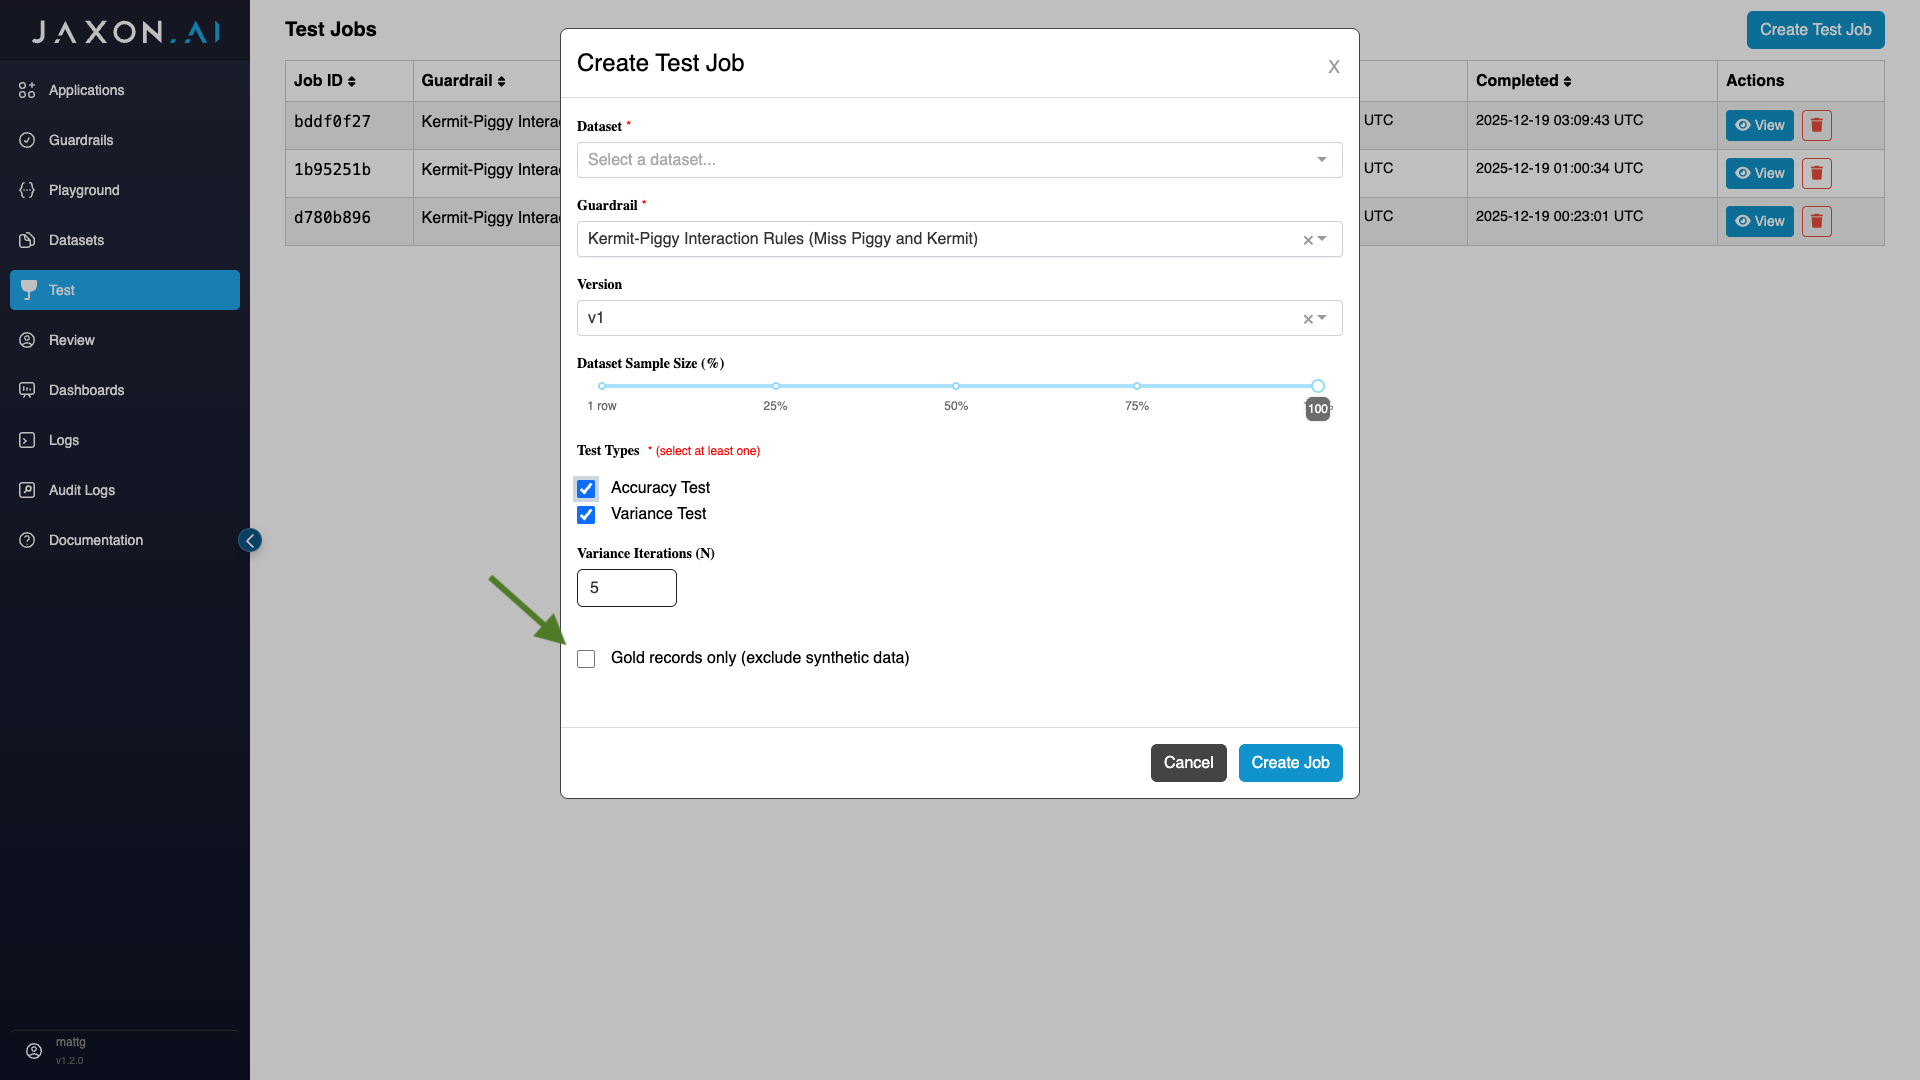
Specifying Test Types
There are two types of tests that can be run against a policy rules guardrail:
-
Accuracy Test: Measures the accuracy of rule results relative to ground truth across all classes - true, false, or unknown, both in aggregate and for each rule individually.
-
Variance Test: All rules are driven by the underlying questions used to gather specific data from the context. The variance test measures the consistency of these responses across a specified number of runs of the policy rules guardrail.
Here you can elect to run one or the other, or both.
Excluding Synthetic Data
If you wish to exclude synthetic data from testing, you can do so by first selecting the test(s) of choice and then indicating that you only want to run the tests with gold records, meaning records that you have provided yourself and not had the system generate for you.
Analyzing Test Results
The test results generated for each dataset are broken up into two sections:
-
Accuracy Results: These are results for the rules themselves and how they performed against each of the rows in the dataset, where each dataset row is a single source content that was evaluated.
-
Variance Results: These are the results for the individual questions that are asked of the source content. They again are broken up first my question and then by rows in the dataset.
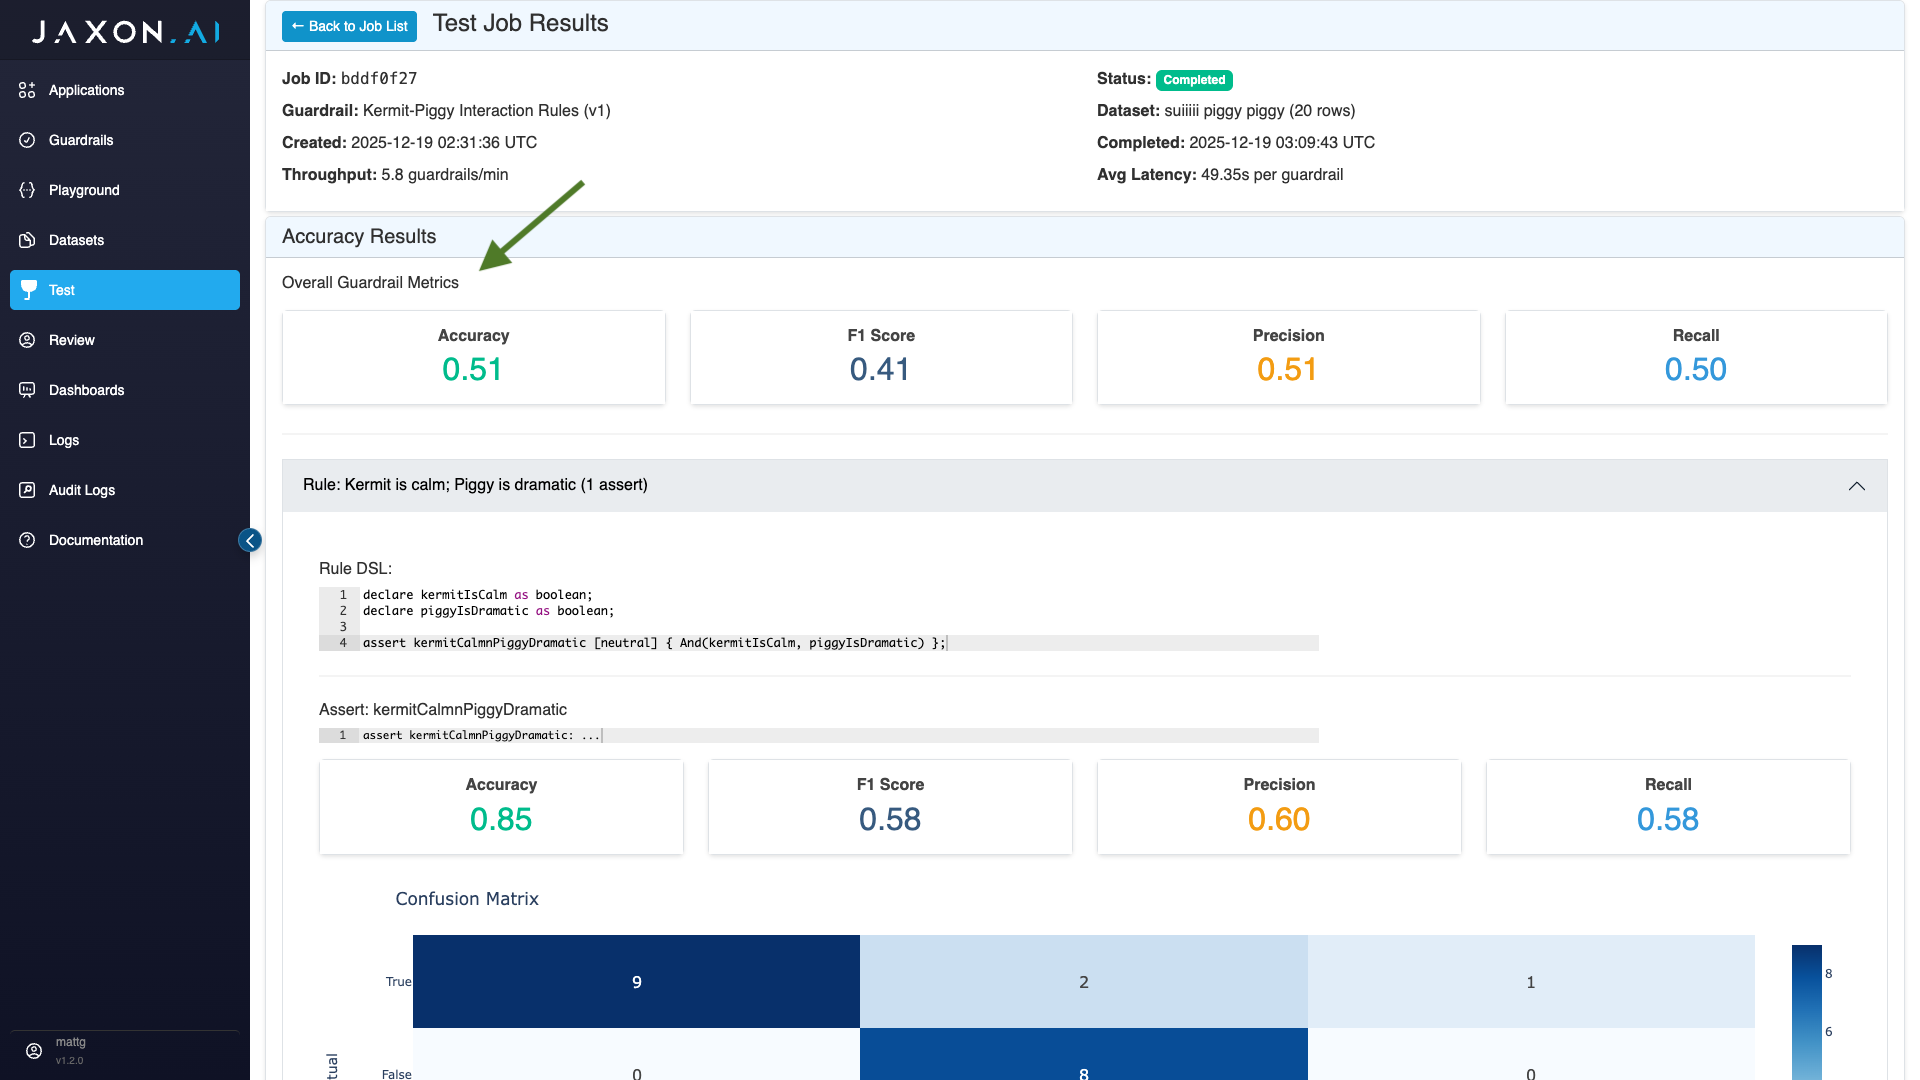
Accuracy Results
The accuracy results provide both an aggregate view of performance across all rules and their associated assertions, and then more granular performance for individual rules and assertions.
Aggregate Metrics
The aggregate metrics provided, referred to in the interface as "Overall Guardrail Metrics," are the following:
- Accuracy: Whether or not the responses where correct for each assertion relative to ground truth across all rows of the dataset.
- F1 Score: A macro F1 score, where F1 scores are computed for each class - true, false and unknown first - and then averaged into a single score.
- Precision: Measures the number of predicted positives relative to the number of actual positives for a given class. Like macro F1 score, this is computed for each class and then averaged.
- Recall: Measures the number of actual positives that were correctly found. This is computed in the same way as precision, described above.
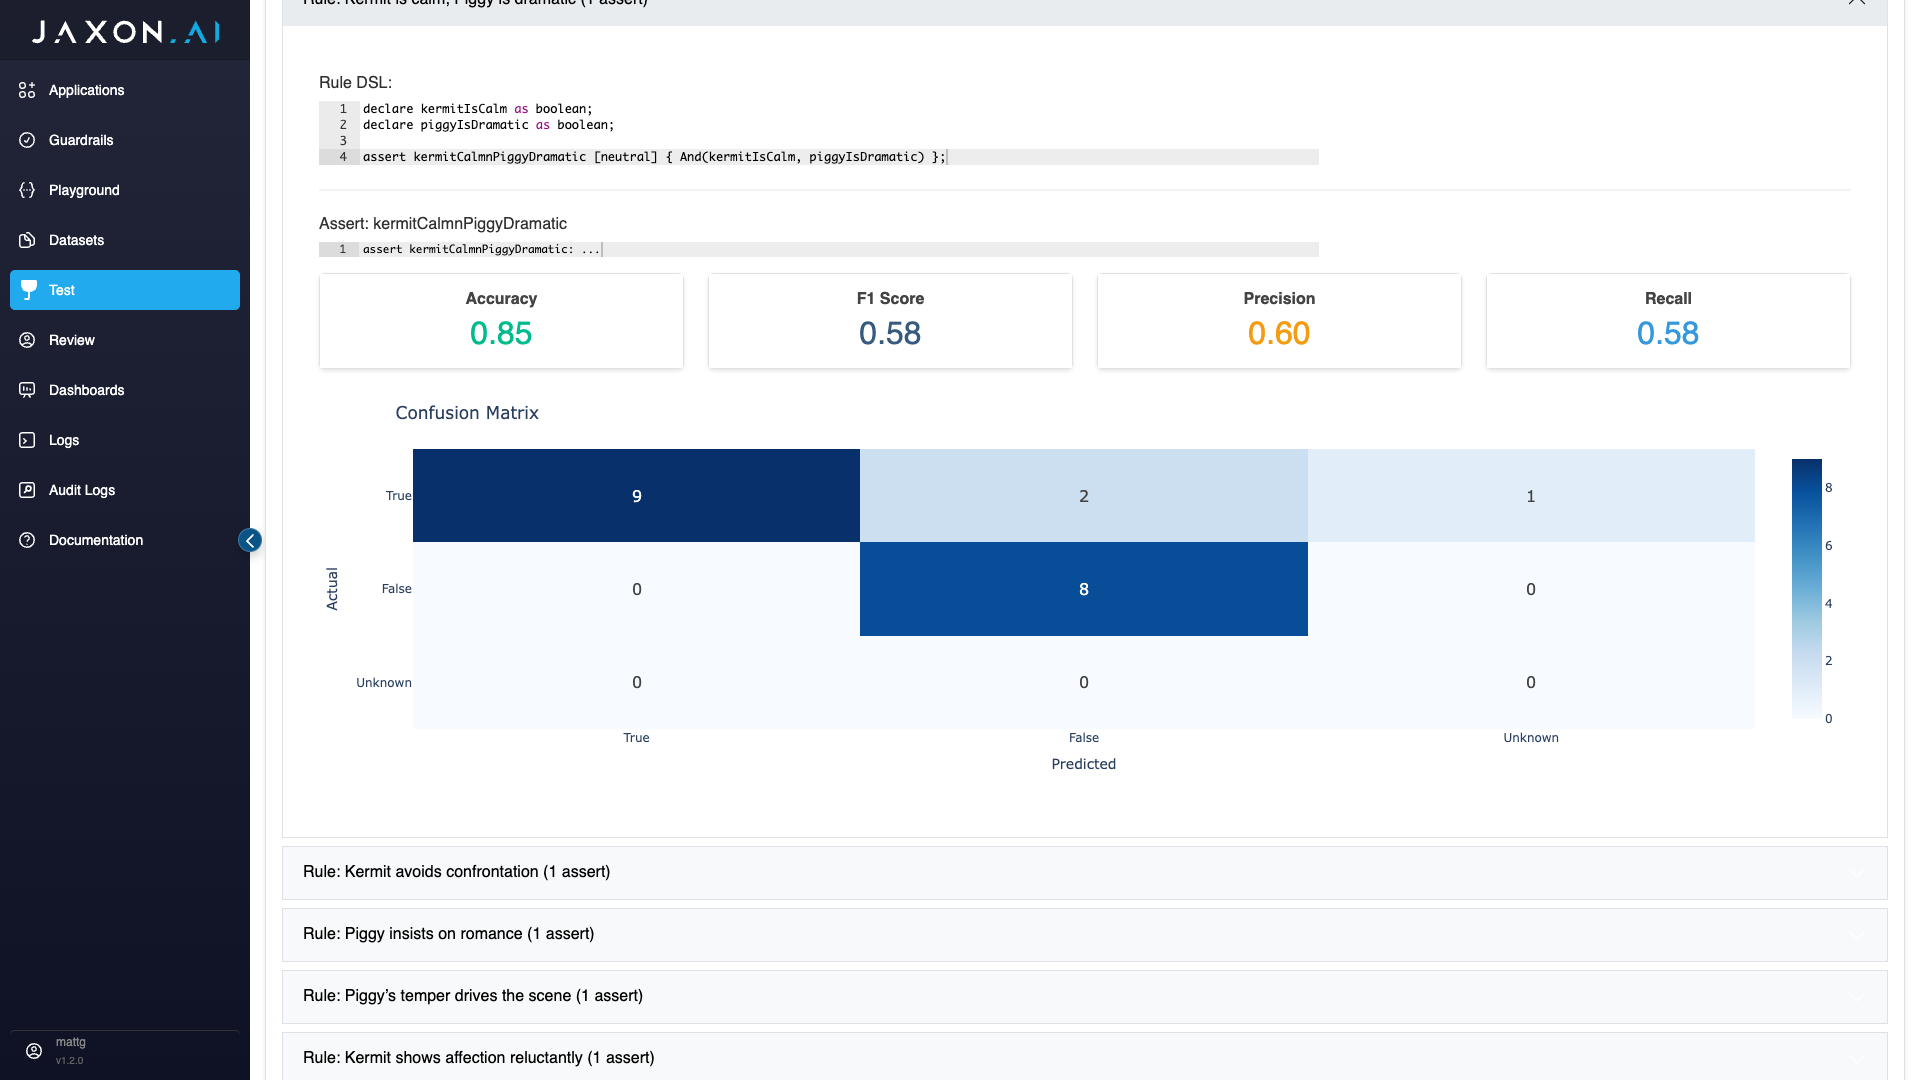
Assert Metrics
The same metrics provided in aggregate are also provided for individual assertions associated with the policy rules guardrail's rules. The only difference here is that these metrics are computed only over each assertion's data, which again is the values returned for the assertion over each row in the original dataset. In addition to accuracy, F1 score, precision, and recall, a confusion matrix is also provided. This shows you how actual versus predicted values across all classes - true, false and unknown.
Variance Results
Variance is a statistical measure that describes how spread out a set of values is around their average. A low variance means values are close to the mean. A high variance means values are widely dispersed. The goal with the variance measure is to have low values across the board, because that indicates strong consistency in the results.
Here we are measuring the variance in question answers. Rules in the policy rules guardrail are tied to one or more assertions in the DSAIL. The assertions then have internal variables, and each one of these maps to one of these questions. This makes the consistency of the question responses critical to the performance of the policy rules guardrail. Each one of these questions is broken out individually in the variance resuls, and there is also an aggregate variance metric.
Each rule in the policy rules guardrail is tied to one or more assertions in the DSAIL, and each of these assertions has some number of questions associated with it. Each of these questions is broken out individually in the variance results, and there is also an average variance calculation.
Summary Metrics
In the "Summary Metrics" section, we currently provide a single metric, which is the average variance across all questions being used. This gives a general sense of how consistent performance is across all questions.
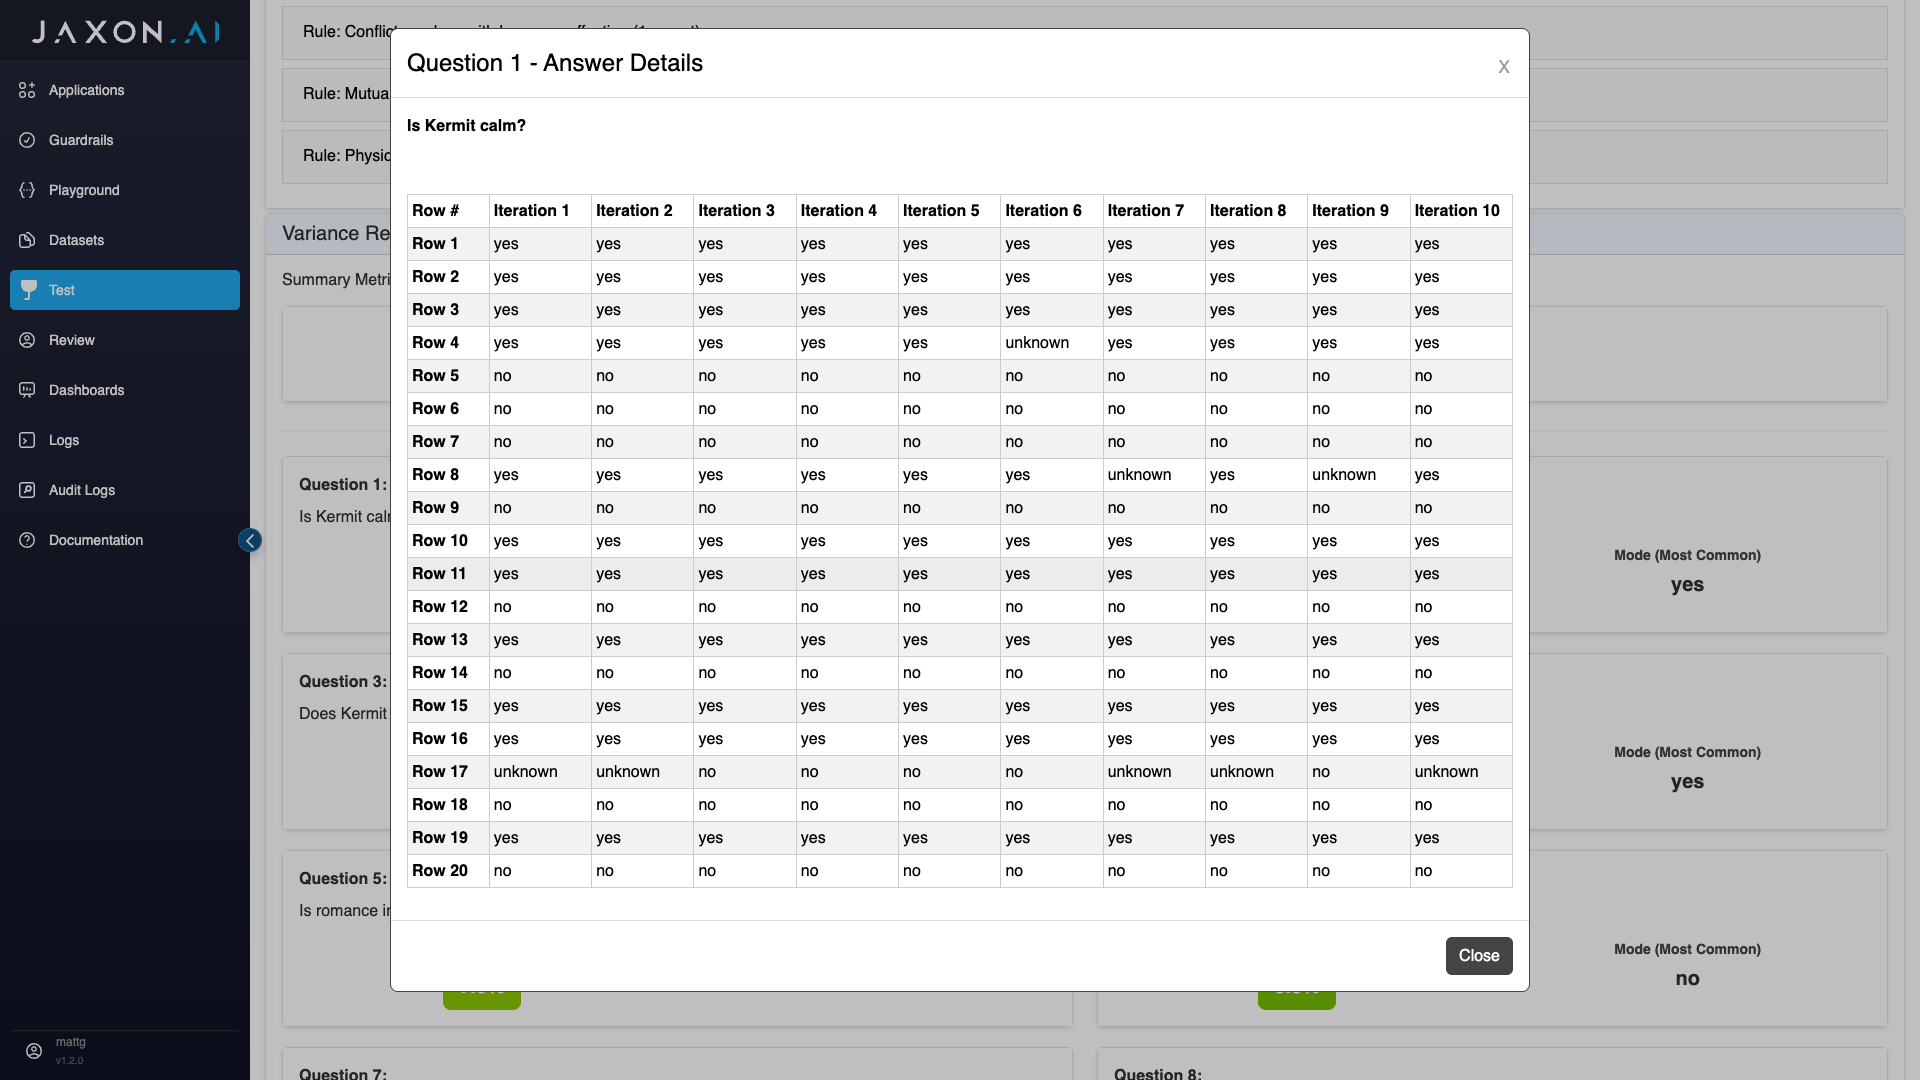
Question Metrics
On the main page, you can see both the variance for each individual question and the mode, which is the most common returned value for that question.
If you click into a given question, you will see the results returned for that question over each row in the dataset and however many iterations of the dataset you chose to run. This shows you detailed data on exactly what data went in to the variance calculations shown.